Within Kettle you have the Normalizer and Denormalizer steps to help with pivoting (a simplified use case for pivoting is changing the row/column axis, see also transpose). Imagine you would like to have a cross table, you may use a Kettle transformation to accomplish this. (In these days Pentaho Reporting’s cross tab functionality is on the road map but not implemented, yet. One solution would be to use a Kettle Transformation as a data source.).
Another solution for a cross tab is to use the SQL CASE WHEN construct. Here is an example:
The result of the following sample query select status, year_id, sum(totalprice) as totalprice from orderfact group by status, year_id looks like this:
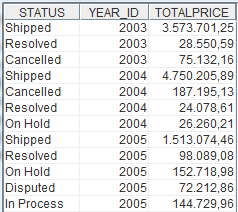
When we want to put the years (2003, 2004, 2005) into separate columns, we can use the SQL CASE WHEN construct:
CASE WHEN Boolean_expression THEN result_expression [ …n ] [ ELSE else_result_expression ]
to accomplish this, e.g.:
select status,
sum(case when year_id=2003 then totalprice else 0 end) as TOTAL_2003,
sum(case when year_id =2004 then totalprice else 0 end) as TOTAL_2004,
sum(case when year_id =2005 then totalprice else 0 end) as TOTAL_2005
from orderfact group by status
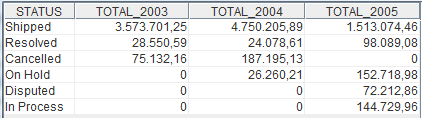
Et voilà, you have data that can be used as a cross tab:
Another use case for dealing with planning data
In another use case, we store actual and planning data (e.g. for turnover, quantity, weights etc.). To make it a bit more challenging, planning data is often stored as a budget and multiple forecasts or different plan versions (scenarios).
One solution for this problem is to store these data in separate columns, e.g. have columns for actual and other columns for planning data. Having multiple measures (see above) needs to have multiple columns for each type of the measures, e.g. turnover_actuals, quantity_actuals etc. and have this also for all types of planning scenarios. Thus you would get a big amount of columns and the biggest issue is: What happens when you need a new planning scenario? You would need to add more columns and your data model is not flexible enough and needs to be changed.
Another solution is to store the definition of an actual or planning type as an extra TYPE_ID in our table. This means each row is marked whether it is an actual or any kind of planning type.
But, when you sum up the whole table, the result would be wrong since it contains a mix of actual and planning data.
This can be solved also with the CASE WHEN construct even within a Mondrian schema definition:
<Measure name=“Sales Actuals“ aggregator=“sum“ formatString=“#,###.00″>
<MeasureExpression> <SQL dialect=“generic“>
(case when type_id=0 then TOTALPRICE else 0 end)
</SQL> </MeasureExpression> </Measure>
<Measure name=“Sales Budget“ aggregator=“sum“ formatString=“#,###.00″>
<MeasureExpression> <SQL dialect=“generic“>
(case when type_id=1 then TOTALPRICE else 0 end)
</SQL> </MeasureExpression> </Measure>
[for more details see the Mondrian documentation about Measures]
With this solution you are flexible with your data model and the result will be correct.
Another more complex use case is to combine this with a reporting solution for project costing or contribution accounting. When you have a large number of different costs and would store these costs in separate columns you will reach a non manageable amount of columns and your data model is not flexible enough. It’s better to store these different types of costs in rows and you are much more flexible.
By all the flexibility with the data model you need to consider performance aspects of your database, e.g. if column based databases behave different with the CASE WHEN (I have not tested this) and different approaches should be tested. Any comments and findings are much appreciated.